
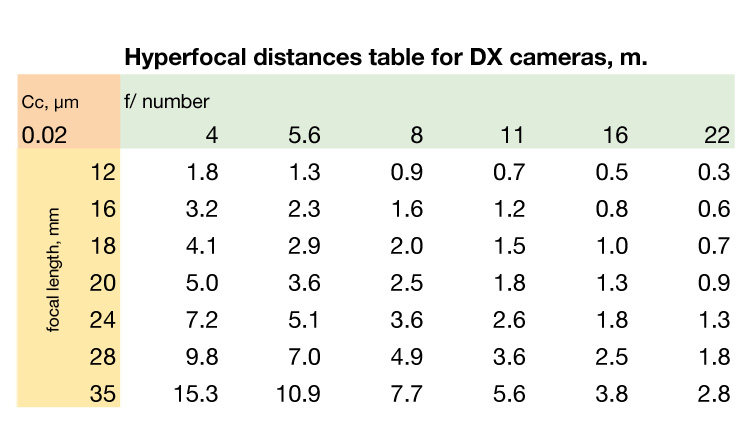
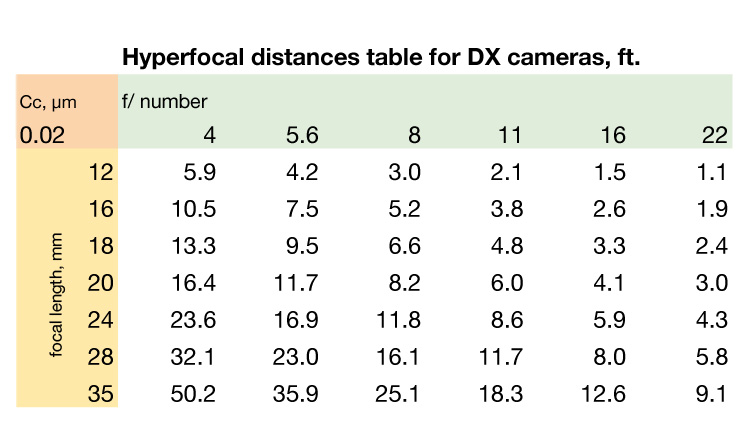
Say you want to take a photo of some beautiful wildflowers on the ground and at the same time include a stream and distant mountains in a shot. The shot looks nice using an 18 mm setting in your zoom lens (or a 28 mm if it is full-frame but I will use DX or APS for my example). You check how far the wildflowers are from the camera: 4 feet or 1.2 m if you like metric. Then you pull out from your wallet a card with a small table and read that if you set your lens at f/8, fix your focus into something that is 7 feet away ( 2 m), recompose and shoot you should get the flowers, the stream and the mountains nice and sharp in your photo.
What you are doing is using something called Hyperfocal Distance Tables. They are readily available and have been in use for decades. A graphical version of these was actually in elegant scales engraved in lenses as Depth of Field markings or even in the software of some cameras. Unfortunately in modern lenses they are either absent or don’t have enough detail for being useful due to the short throw design of the focusing helicoid as I mention in my previous, introductory post. Click here if you want to read it.

After you get home and see your wildflower pictures on the computer at first they look awesome. Then, you start to zoom in to see if your focus was fine or if you could not hold well your camera and eventually, maybe at a 100 % view or before, your flowers and the mountains don’t look quite sharp… what is going on?
Well, you are not alone: just search the web and you will see a lot of complaints about Hyperfocal Distance Tables and Depth of Field Scales and strong opinions about just how futile they apparently are.
I used for a long time the same technique I mention with good success but, when cameras reached 24 MP, the tables did not seem to deliver. Was the problem in the tables themselves or in the increased resolution of the sensors? I know that even in the old days photographers actually chose smaller apertures (larger f/stops) than those indicated in the tables just for good measure as they provided increased sharpness and depth of field.
I then looked carefully at how to use the tables in the references that explained the assumptions and limitations taken into account when calculating them and I think I see now where the problem is. Let me explain:
If you take a photo for showing it to your friends you do it either on print at maybe 4×6 inches or letter sized at most. Often this is the case also for photojournalists publishing in magazines. Of course, this being 2014, 4×6 inches are actually Facebook uploads and letter-sized prints are tablet displays. By the way, did you know that the wonderful and much talked about iPad Air screen is “only” 3 MP or that National Geographic’s minimum resolution for images is 6 MP?

Returning to your nice photo: If you want to hang it on a wall then you print at 16×20 inches or even larger, maybe at 24×36 inches and your visitors will be able to stand in front of your photo holding a glass of wine to congratulate you.
The problem is that a lot of photographers do not see other people’s photos that way. I can always spot who is a photographer or a prepress guy at my exhibits: They get so close to my prints I swear they are actually sniffing them! The same is true when they sit at the computer screen, where seeing a photo at 100 % is like examining it with a large magnifying glass.
Depth of Field Tables are for creating prints (or screen displays) that will be viewed by normal people that care about the image and your art. Your photo of wildflowers is fine as long as you show it to those who appreciate your sense of composition and esthetics. Nobody walks into a gallery asking for the sharpest picture they have. Ansel Adams said: There is nothing worse than a sharp image of a fuzzy concept.
Now, I must admit that in photos that I intend to print big I actually play it safe and stop down my lens at least one stop more than indicated by the tables, as long as I don’t go beyond f/11 in DX cameras or f/16 in FX cameras. How do I know? Well, I just set up my camera on a tripod, frame both nearby plants and distant trees or mountains, shoot at the indicated hyperfocal distance and f/stop for my focal length and then make comparison shots using larger f/numbers.
If you want to see a real test, you are welcome to download one of mine from Flickr. Here are links for both types of common sensors. Do print the files and please tell me where you draw your own line. If you cannot print them, look at them on a retina quality display at the indicated size for the crops.
test for 8×10 in print from DX (APS) sensor camera
test for 16×20 in print from DX (APS) sensor camera
test for 8×10 in print from FX full sensor camera
test for 16×20 in print from FX full sensor camera
Look: I am actually a sharpness freak. Nothing pleases me more than seeing a 36 MP image sharply rendered by my best lenses. However, there are times when good depth of field is more important than sharpness in the focal plane. Check the apertures used by professional macro photographers and you will see what I mean.
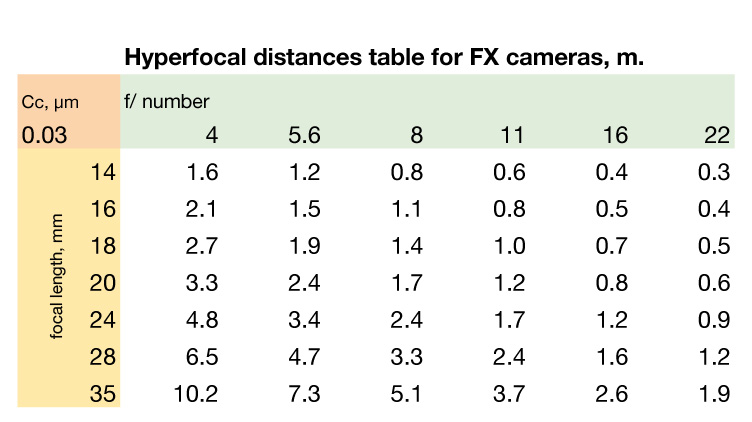
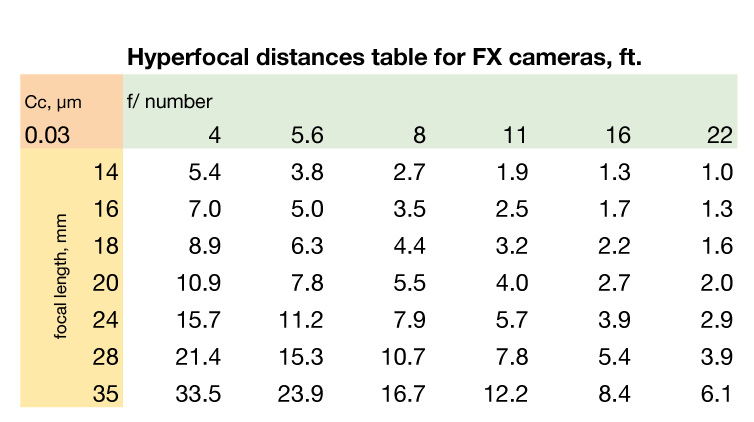
You need different tables for each sensor or film size. This has to do with the amount of enlargement needed to make a print and depends on a number called “confusion circle” which is the smallest feature in the sensor or negative that you can see after making the final print).
Remember this:
A camera lens focused at the hyperfocal distance will have a depth of field ranging from one-half of the hyperfocal distance to infinity.
A camera lens focused at infinity will have a depth of field ranging from the hyperfocal distance to infinity.
Finally, don’t forget this:
Hyperfocal Distance Tables and Depth of Field markings assume you will be viewing the print from a reasonable distance: 13 in for an 8×10 print, 26 in for a 16×20 and so on… if you print big, use a larger f/stop or get tables calculated using a smaller confusion circle (0.02 or 0.025 instead of 0.03 µm for full frame, and maybe 0.015 instead of 0.02 µm for APS sensors).
If you want specific hyperfocal distance tables let me know and I will EMail them to you. If you have better ways, please share them here!
I love to see people making great photos!


In the hyperfocal charts, what do the numbers in the first column (higlighted yellow) mean?
LikeLike
Focal length (I put it in the title to make the table compact) but if it’s confusing I better fix it, thanks.
LikeLike
Thanks Eduardo.
LikeLike
A fantastic post, Eduardo! Thank you for this very valuable data.
LikeLiked by 1 person